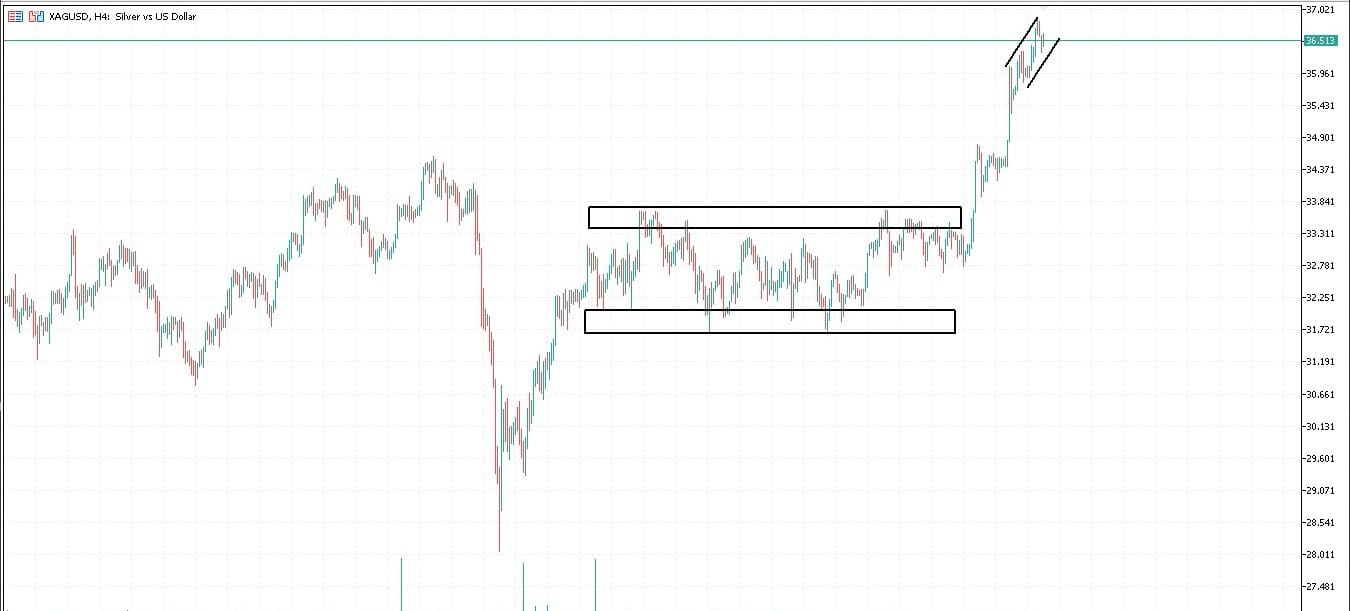
XAG/USD Technical Analysis
Key Price Levels
Price Level Role Comment
$31.95207 Major Support Strong buy zone; previously tested and respected by price.
$33.68631 Resistance (broken) Resistance that was broken, turned into intermediate support.
$34.09656 Breakout Level Break above here confirmed bullish continuation.
$35.40191–$36.83779 Parallel Channel (current range) Price is oscillating within this bullish channel.
Technical Summary
Trend: Bullish
Structure: After breaking above $34.09656, XAG/USD formed a parallel ascending channel, showing a steady bullish momentum.
Support Zones:
Primary: $31.95207
Secondary: $33.68631 (former resistance turned support)
Resistance Zones:
Near-term: Top of the current channel around $36.83779
If broken: Potential to move toward $37.50–$38.00 Technical Indicators (Assumed Current Conditions)
RSI: Likely near or above 70 → Overbought territory (watch for divergence).
MACD: Strong bullish histogram, wide spread between lines.
Volume: Spike on breakout above $34.09656 indicates strong buying interest.
Trading Strategy Ideas
Scenario 1: Continuation Within Channel
Buy on dip to lower channel edge ($35.40), target upper edge ($36.80).
SL: Below $34.80 for safety.
Scenario 2: Breakout Above Channel
Buy breakout above $36.84, target $38.00+.
SL: Tight below $36.30 to reduce risk.
Scenario 3: False Breakout & Rejection
Sell rejection near $36.84 if bearish engulfing or divergence appears.
Target: $35.40 or $34.10.
SL: Just above $37.00.
Leave A Comment