Technical analysis for GBPUSD:
Market Context
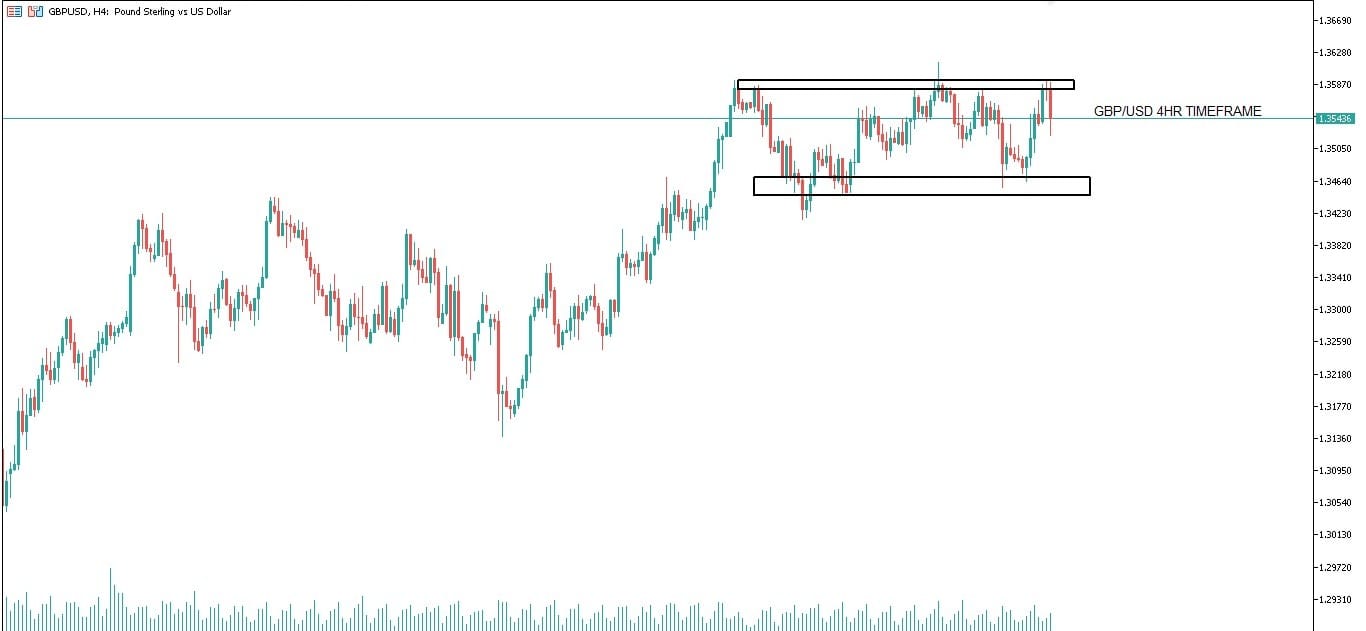
Support at 1.34988: This is a key horizontal level that previously acted as a buy zone.
Resistance at 1.35846: A supply zone or prior swing high where sellers stepped in before.
Technical Structure
Element Description
Trend Neutral to bullish short-term, depending on price behavior above support.
Support 1.34988 — Watch for potential bullish price action (e.g., bullish engulfing, hammer).
Resistance 1.35846 — May trigger selling pressure if tested without momentum.
Scenarios
Bullish Case (Reversal or Continuation)
Price holds above 1.34988 with bullish candlestick confirmation.
Targets:
1.35846 (short-term)
Breakout above 1.35846 → potential continuation toward 1.36400 or higher.
Volume/RSI/MACD should support upward momentum for breakout.
Bearish Case (Breakdown)
Break and close below 1.34988 confirms bearish sentiment.
Retest and failure at 1.34988 = short setup.
Next possible target: 1.34400 or 1.33800 (lower support zones).
Indicators for Confluence
Indicator Signal to Watch
RSI Overbought near resistance or oversold near support.
MACD Bullish crossover near 1.34988 = buy signal.
Volume Spike near breakout levels = likely continuation.
Leave A Comment