Analysis for XAU/USD
Bearish Resistance Zone
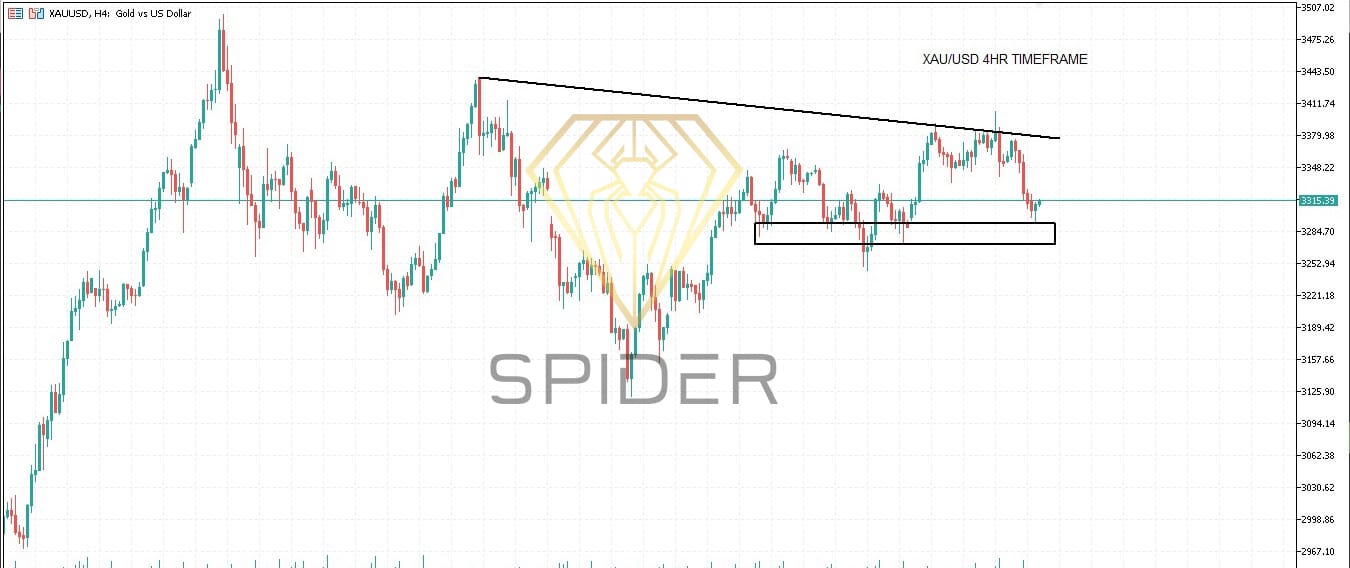
Resistance Levels: The price has encountered resistance between $3,433.141 and $3,381.881, indicating a potential area for price rejection.
Market Behavior: Recent price action shows a series of lower highs and lower lows, suggesting a bearish trend.
Support Level
Key Support: The $3,294.395 level has acted as a significant support zone, holding the price above it in recent trading sessions.
Potential for Bounce: If the price approaches this support level again, there may be a possibility of a bullish reversal or consolidation.
Trading Scenarios
Bearish Scenario
Entry Point: Consider selling if the price fails to break above the resistance zone and shows signs of rejection.
Target Levels: Potential targets include the support level at $3,294.395 and further downside levels if the support is broken.
Bullish Scenario
Entry Point: A buy position could be considered if the price successfully breaks above the resistance zone with strong volume and momentum.
Target Levels: Initial targets would be the previous highs near $3,433.141, with further upside potential if the bullish trend continues.
Technical Indicators
RSI (Relative Strength Index): Currently at 43, indicating neutral momentum with a slight bearish bias.
Moving Averages: The price is trading below the 50-period and 200-period moving averages, reinforcing the bearish outlook.
MACD (Moving Average Convergence Divergence): Shows a bearish crossover, supporting the potential for downward movement.
Leave A Comment