XRP/USDT Technical Analysis
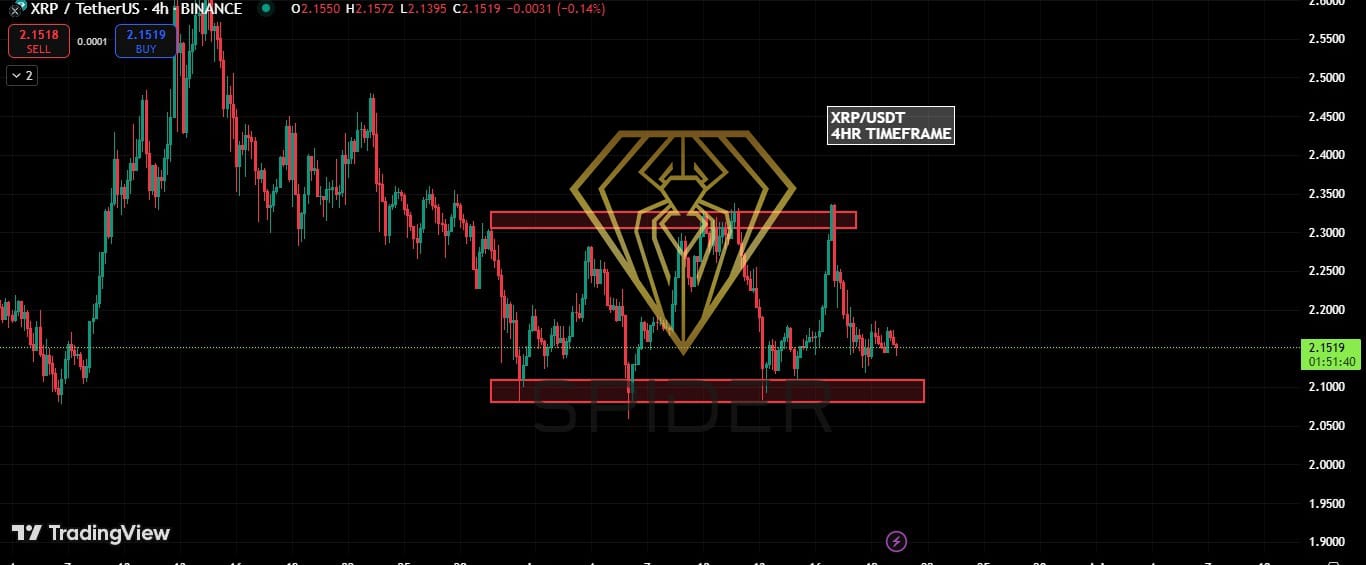
Support Level – $2.0915
This is a critical horizontal support zone, where XRP has shown buying interest in past pullbacks.
A confirmed bounce from this level indicates strong accumulation and offers a potential long entry.
However, if broken, this level could flip into resistance, opening downside potential toward $1.96–1.90.
Resistance Level – $2.3222
Price has previously failed to break this resistance, showing strong selling pressure.
This level marks a significant barrier to further upside, and a breakout above it would suggest a bullish continuation toward the $2.45–2.50 zone.
Market Structure
XRP is currently trading within a horizontal range between $2.0915 and $2.3222.
No clear trend unless a breakout occurs from either boundary.
Trade Signals
Bullish Setup
Buy Entry #1 (Bounce from Support):
Enter near $2.0915, with bullish confirmation (hammer, bullish engulfing).
Target: $2.18 → $2.25 → $2.32
Stop-loss: Below $2.05
Buy Entry #2 (Breakout Trade):
Buy on confirmed breakout above $2.3222 with strong volume.
Target: $2.45 → $2.50+
Stop-loss: Below $2.29 (retest zone)
Bearish Setup
Sell Entry #1 (Rejection at Resistance):
Short near $2.32 if strong bearish candles form (shooting star, bearish engulfing)
Target: $2.18 → $2.10
Stop-loss: Above $2.35
Sell Entry #2 (Breakdown Trade):
Short if price breaks below $2.0915 with high volume and fails to recover.
Target: $2.00 → $1.92
Stop-loss: Above $2.12
Leave A Comment