Technical Analysis
Resistance at $3,503.027: This level has been a significant barrier, with gold struggling to close above it in recent sessions. A sustained breakout above this resistance could signal a continuation of the bullish trend, potentially targeting the next resistance zone around $3,550–$3,600.
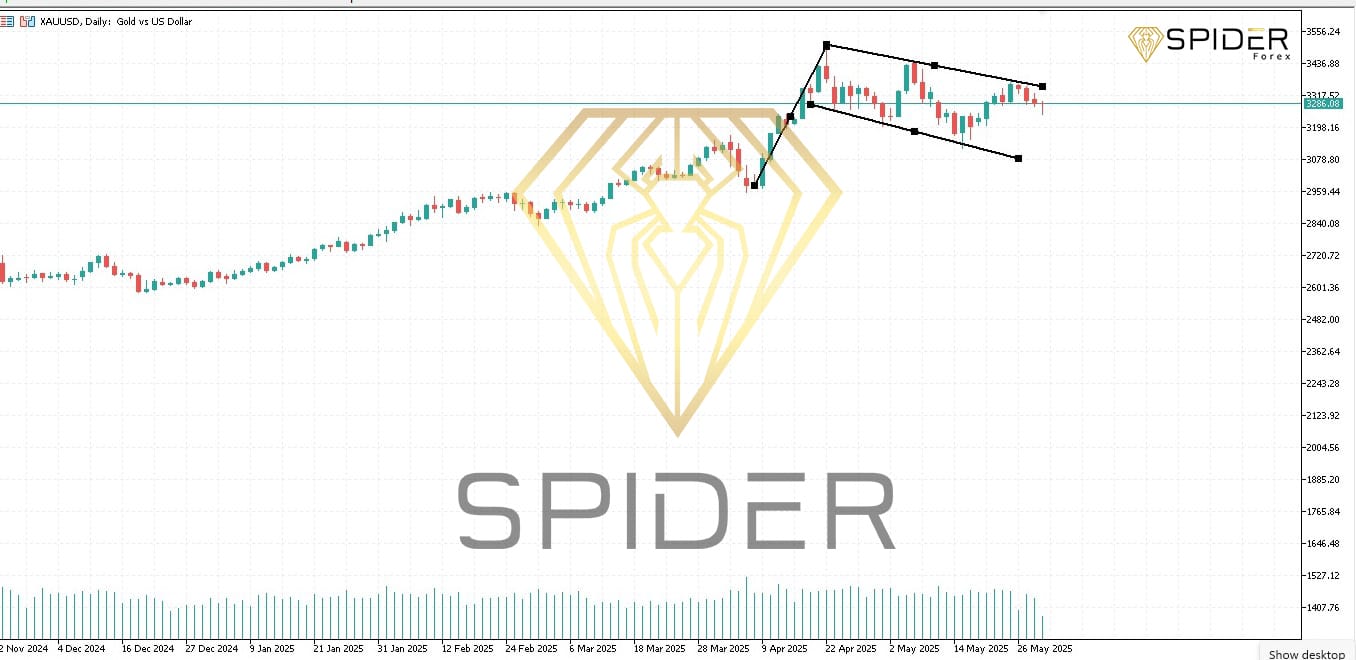
Support at $3,285.396: This support level has provided a floor for gold prices, with multiple tests and rebounds observed. A failure to hold above this support could lead to a deeper correction, with the next support levels around $3,250 and $3,200.
Trend Analysis: Gold is currently in a consolidation phase between these key levels. The formation of a descending wedge pattern suggests a potential breakout, but the direction remains uncertain. Traders should watch for a decisive move beyond either the resistance or support to determine the next trend.
Indicators: The Relative Strength Index (RSI) is hovering around neutral territory, indicating a balance between buying and selling pressures. The Moving Average Convergence Divergence (MACD) is showing a slight bullish divergence, suggesting potential upward momentum if the resistance is breached.
Potential Scenarios
Bullish Scenario: A breakout above $3,503.027, accompanied by increased volume and positive momentum indicators, could lead to a rally towards the $3,550–$3,600 resistance zone. Traders might consider entering long positions on a confirmed breakout with a stop-loss below the breakout point.
Bearish Scenario: A failure to hold above $3,285.396 and a breakdown below this support could trigger a sell-off towards the $3,250 and $3,200 support levels. Short positions could be considered on a confirmed breakdown, with a stop-loss above the breakdown point.
Leave A Comment