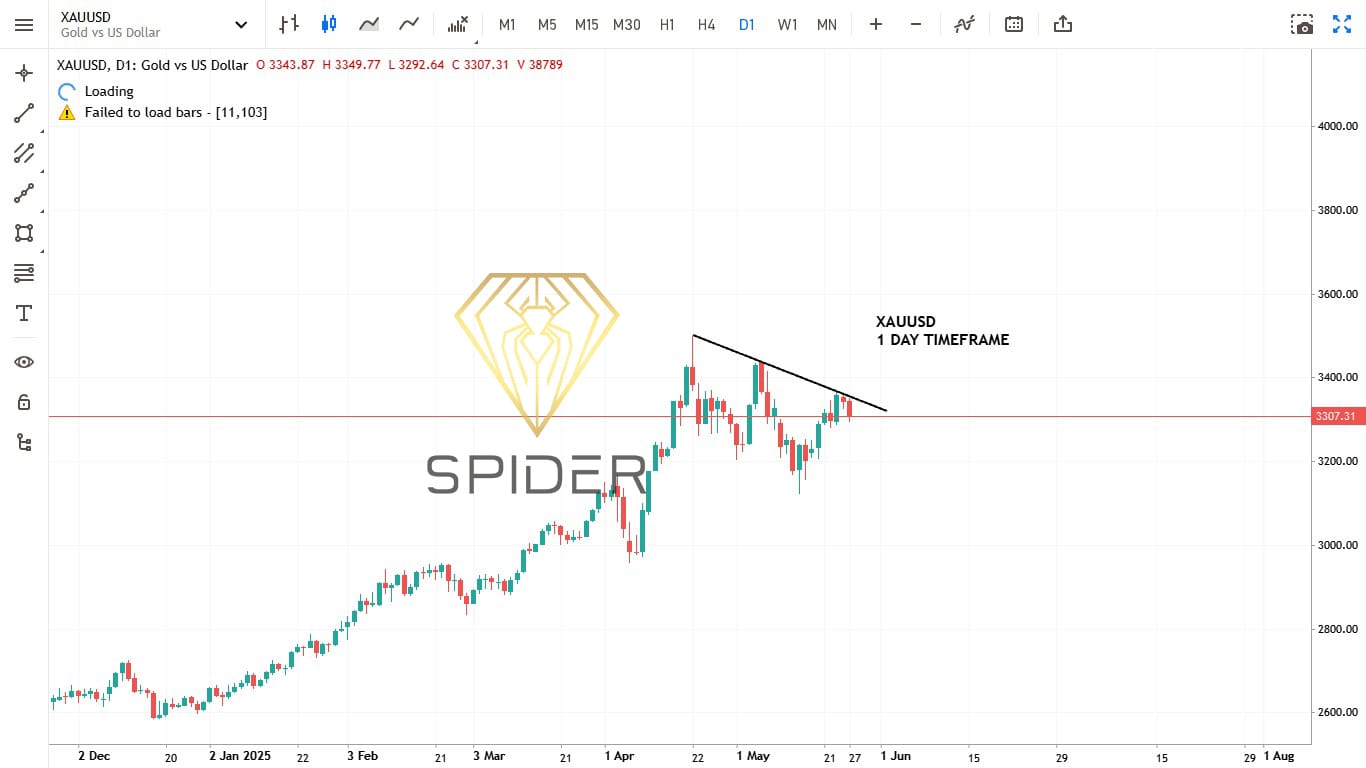
📉 Trendline Analysis: 3499.68 → 3303.48
- Trendline Characteristics
Slope: The trendline exhibits a moderate bearish slope, indicating a gradual decline in gold prices over the observed period.
Positioning: Currently, XAU/USD is trading below this trendline, reinforcing the prevailing bearish sentiment.
- Technical Indicators
Relative Strength Index (RSI): The RSI is positioned around 46.20, suggesting a neutral market without strong overbought or oversold conditions.
Moving Averages:
Short-term (MA5, MA10, MA20): These moving averages are positioned below the current price, indicating potential short-term support levels.
Long-term (MA50, MA100, MA200): These averages are above the current price, suggesting long-term resistance zones.
MACD (12,26): The MACD line is above the signal line, signaling a bullish crossover and potential upward momentum.
Stochastic Oscillator: The current reading indicates neutral territory, with no immediate overbought or oversold signals.
📊 Price Action & Support/Resistance Levels
Resistance Zone: The area around 3358.62 has previously acted as a strong resistance, with price failing to sustain above this level.
Support Levels:
3260–3270: This zone has served as a significant support area, with multiple bounces observed. A breakdown below this level could signal further downside potential.
Leave A Comment