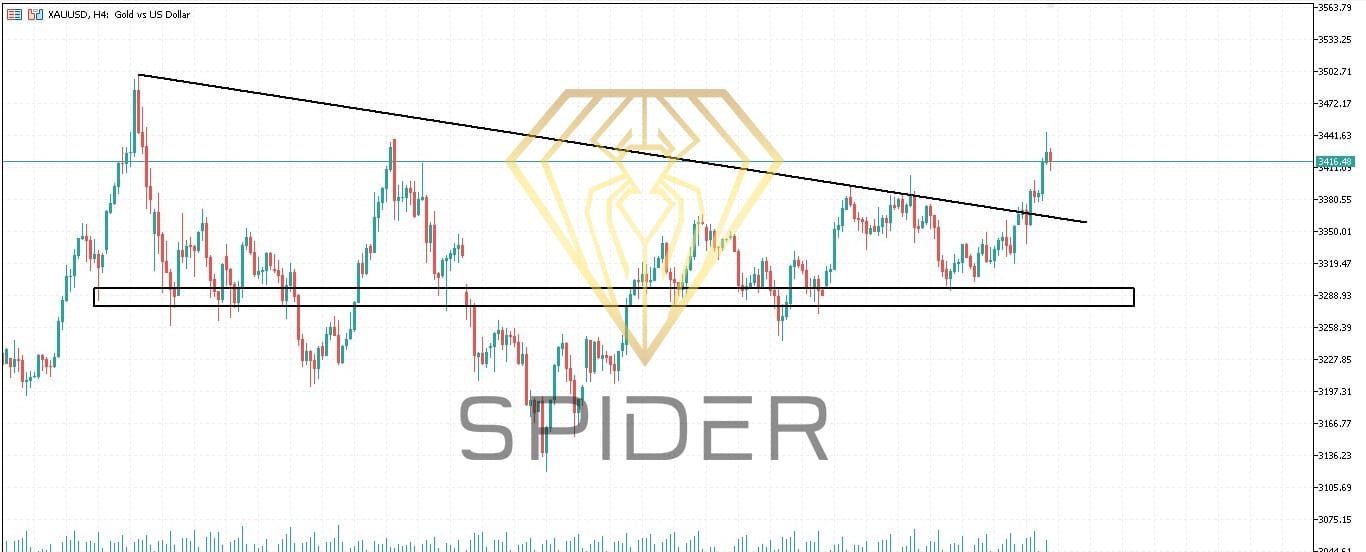
Technical Analysis for XAU/USD Recent Breakout: $3,364.48 Resistance
Gold has successfully breached the significant resistance level at $3,364.48, indicating a potential continuation of the bullish trend. This breakout suggests that the market sentiment is leaning towards further upward movement, provided the price maintains above this level.
Support Level: $3,272.27
The $3,272.27 level now acts as a crucial support zone. A pullback towards this area could offer a buying opportunity, especially if the price holds above this support. Failure to maintain this support could lead to a retracement towards lower levels.
Resistance Zone: $3,499.25 – $3,364.48
The region between $3,499.25 and $3,364.48 serves as a dynamic resistance zone. A breakout above $3,499.25 could pave the way for further gains, potentially targeting new highs. However, if the price faces rejection within this zone, a consolidation or pullback could occur.
Technical Indicators
Relative Strength Index (RSI): Currently near 63, suggesting bullish momentum without being overbought.
Moving Averages: A bullish Simple Moving Average (SMA) crossover supports the upward trend.
Trading Strategy
Bullish Scenario: If Gold maintains above the $3,364.48 support level, consider entering long positions with targets towards the $3,499.25 resistance zone.
Bearish Scenario: A failure to hold above $3,272.27 could lead to a retracement, with potential targets at lower support levels. Reasons for Gold’s Upward Movement
The recent spike in gold prices is primarily attributed to heightened demand for safe-haven assets amid the Israel-Iran conflict. Israel’s airstrikes on Iran’s nuclear facilities have escalated tensions, leading to fears of a broader regional conflict. In response, investors have flocked to gold as a secure store of value
Additionally, U.S. economic data indicating a cooling labor market and subdued inflation have increased expectations of a Federal Reserve interest rate cut, further supporting gold prices .
Leave A Comment