XAG/USD (Silver) Technical Analysis — 4H Timeframe
Current Price: Not provided (based on structure)
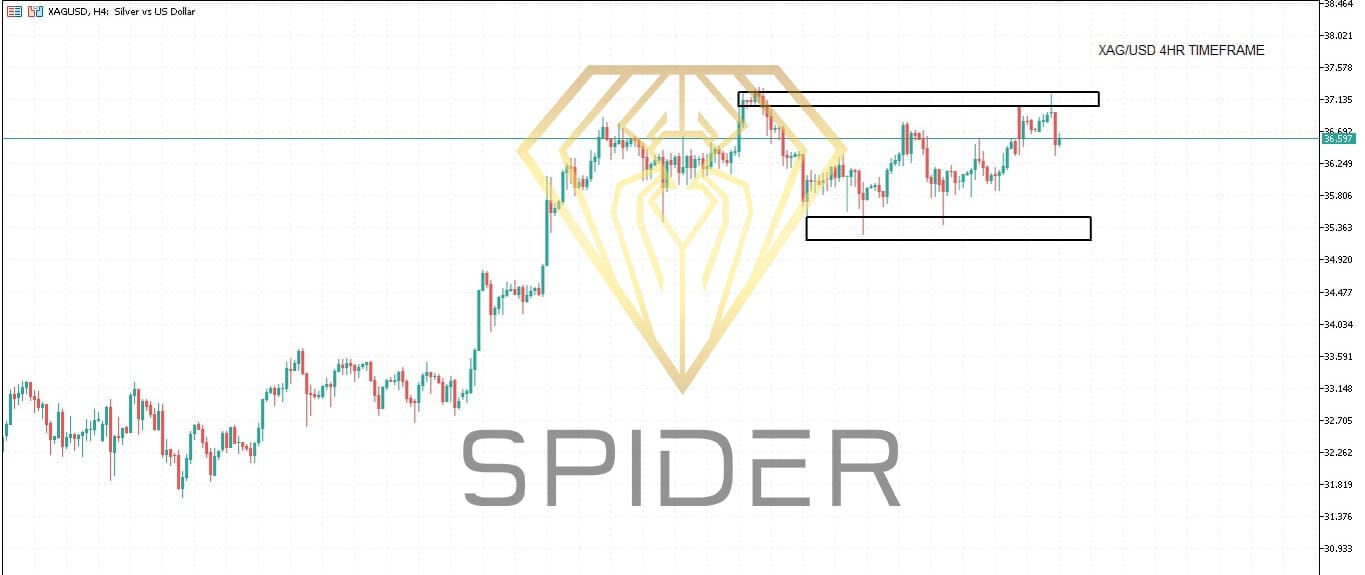
Resistance Level: 37.15510
Support Level: 35.49214
Market Structure Overview:
• Silver (XAG/USD) is currently trading within a defined range between the strong support zone at 35.49214 and the resistance zone at 37.15510.
- The overall price action shows consolidation, with several price reactions confirming both levels as significant.
- Price has recently approached or is approaching the resistance zone, making this area critical for the next directional move. Bullish Scenario:
A confirmed breakout and sustained move above 37.15510 would indicate bullish continuation.
Buyers may target the next levels at:
37.50000 (psychological round number)
38.20000 (previous swing high zone)
Bullish Entry: After confirmed breakout and retest of 37.15510, look for bullish candlestick patterns like bullish engulfing or pin bars
Stop Loss: Below 36.90000
First Target: 37.50
Second Target: 38.20
Bearish Scenario:
If price fails to break above 37.15510 and shows rejection signals (e.g., bearish pin bars, shooting star candles), expect a potential pullback toward support.
Breakdown below 35.49214 would signal bearish continuation toward:
35.00000
34.50000
Bearish Entry: On bearish rejection near 37.15510, or breakdown below 35.49214.
Stop Loss: Above 37.30000
First Target: 35.49214
Second Target (if breakdown): 35.00000
Additional Considerations:
Silver often reacts to USD strength, inflation news, and risk sentiment. Watch for global macroeconomic updates.
Increased volatility may occur around key U.S. economic releases or Federal Reserve announcements.
Leave A Comment