Support at 0.58993
Resistance at 0.60151
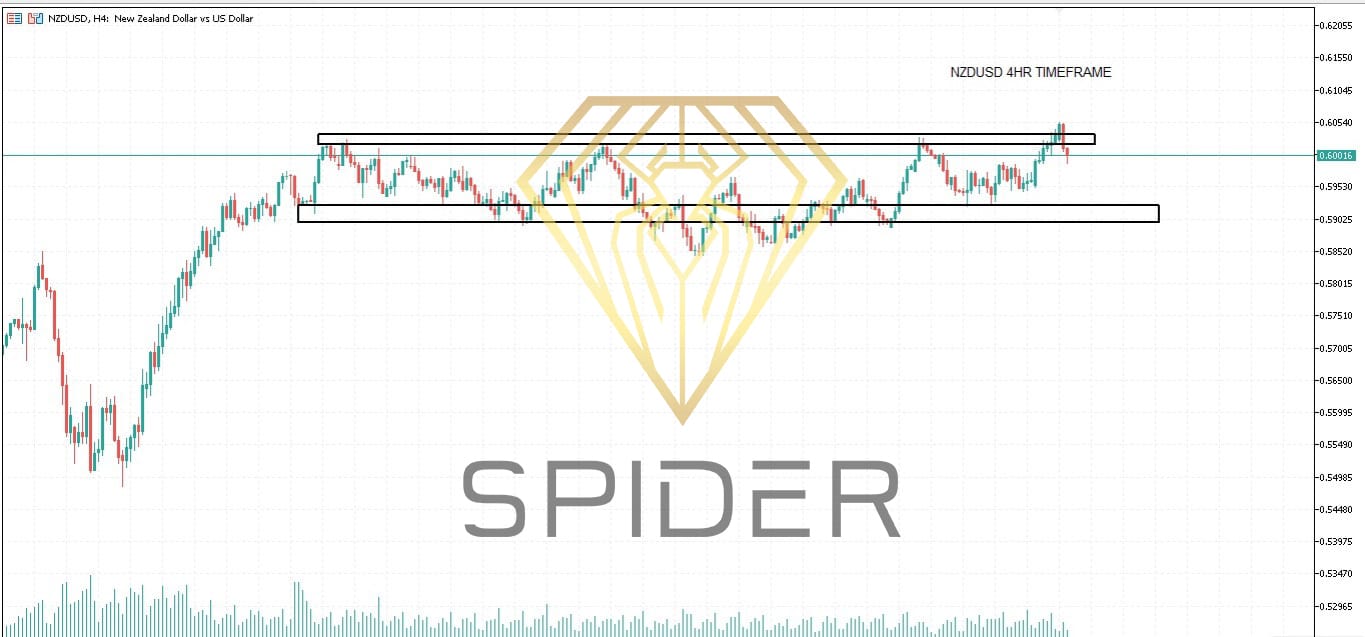
- Support at 0.58993
This level is acting as a key demand zone, where buyers previously entered the market and pushed the price higher. The more times this level is tested and holds, the stronger it becomes.
A bounce from this level suggests bullish interest.
A break below it could trigger further downside, especially if accompanied by high volume or bearish candlestick patterns.
- Resistance at 0.60151
This is a significant supply zone, where sellers have stepped in and reversed upward moves.
If price approaches this level again, look for reversal signs (e.g., bearish engulfing, shooting star) or a breakout.
A clean breakout above 0.60151 (ideally with volume) would suggest bullish continuation and possibly a shift in the medium-term trend.
- Range-Bound Behavior
Since price is moving between support (0.58993) and resistance (0.60151), NZD/USD is currently in a sideways consolidation range:
Buy near support, sell near resistance.
Wait for a breakout from either side to confirm trend direction.
Strategy Ideas:
Scenario Action
Bounce from 0.58993 Consider long positions with stop just below support
Rejection from 0.60151 Consider short positions with stop above resistance
Break above 0.60151 Watch for bullish continuation, buy on retest
Break below 0.58993 Watch for bearish move, sell on retest
Indicators to Watch:
RSI near overbought/oversold at these levels may signal potential reversals.
Volume spikes near support/resistance can confirm the strength of moves.
MACD crossover near these levels may help signal direction.
Leave A Comment