Technical Breakdown For ETH
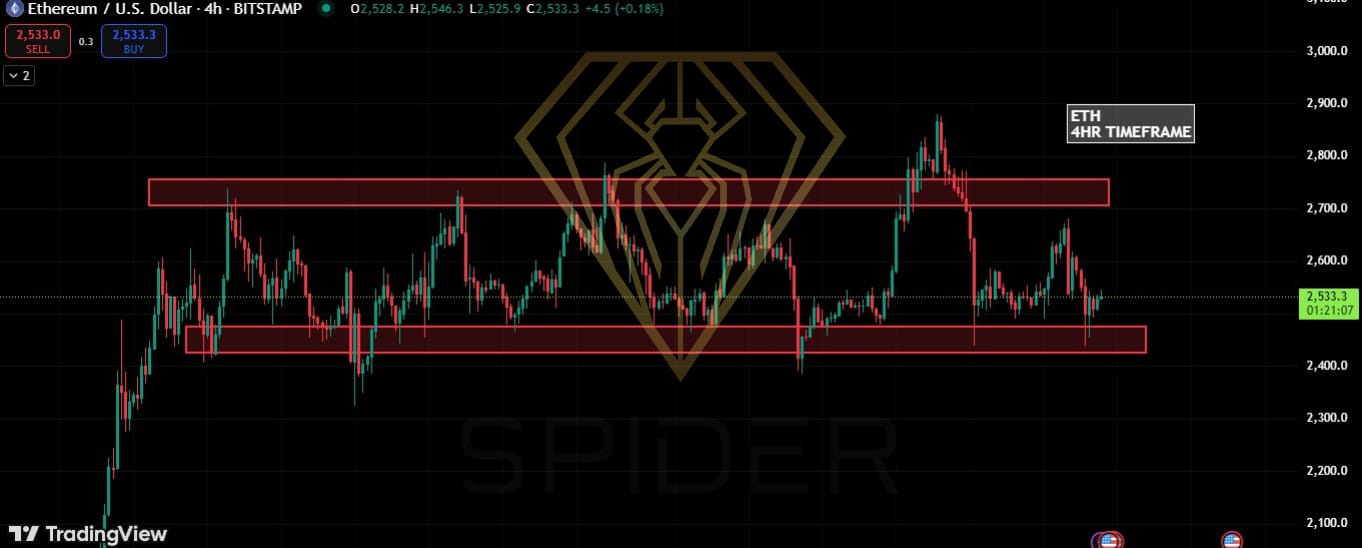
Resistance at 2733.7
Observation: ETH faced repeated rejection at 2733.7, confirming it as a strong resistance zone.
Implication: Sellers are active at this level, and failure to sustain above it often leads to pullbacks.
⚠️Fake Breakout Above 2787.6
Event: ETH broke above 2787.6, but quickly fell back below.
Interpretation:
This is a bull trap — price attracted breakout traders but lacked volume or momentum to sustain.
It indicates weak bullish conviction and potential for downside pressure.
Market Psychology: Traders who bought the breakout are now trapped and may contribute to selling pressure.
Support at 2429.8
Importance: This is a crucial support level and possible demand zone.
Implication:
If ETH falls further, 2429.8 is the next major level to watch for a bounce.
A breakdown below 2429.8 could trigger deeper losses.
Market Structure Outlook
Bullish Scenario
Condition: ETH must reclaim 2733.7 with strong momentum and retest 2787.6 with confirmation.
Confirmation Signals: High volume breakout, higher low formation, bullish candlestick structure.
Targets: 2850–2900 (next resistance zone).
Bearish Scenario
Condition: Sustained rejection below 2733.7 + confirmation of the fake breakout.
Likely Path: Continued selloff toward 2520, and potentially support at 2429.8.
Break Below 2429.8: Signals deeper correction — could target 2300 or lower.
📉Summary
ETH is currently bearish-to-neutral after a fake breakout above 2787.6.
2733.7 remains a solid resistance.
2429.8 is the critical support that must hold to prevent further downside.
Trade with caution near these key zones, and wait for confirmation before positioning.
Leave A Comment