Technical analysis for BTC/USD based on the levels
Key Levels
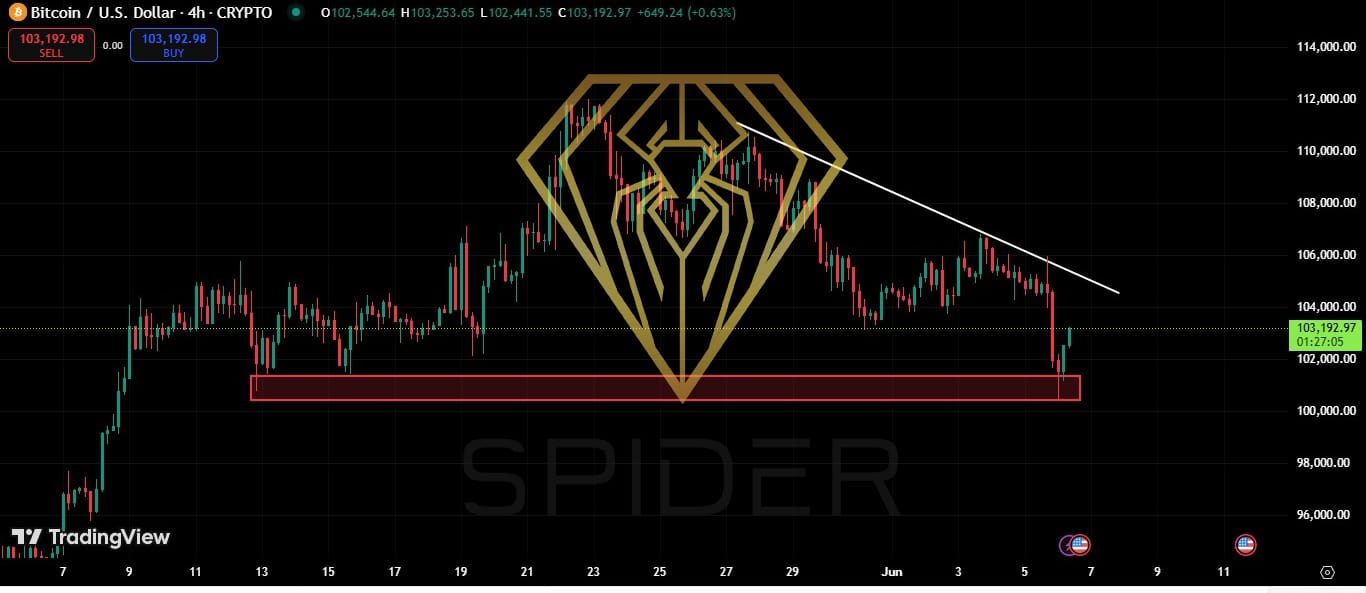
Support: $101,370.28
Bearish Trendline Resistance: ~$110,840.74
Technical Overview
- Current Structure
Price is trading below a descending trendline, indicating ongoing bearish pressure.
Support at $101,370.28 has held previously, suggesting a critical demand zone.
Bearish Trendline Dynamics
The trendline at $110,840.74 marks lower highs, which confirms sellers are still active.
Multiple rejections at or near this trendline reinforce it as a valid resistance.
Bears may continue to short rallies into this area.
Support Level: $101,370.28
This level is crucial:
If held, BTC may attempt another rally toward the trendline.
If broken, BTC could test deeper levels: e.g., $97,500 or $92,000.
Scenario Analysis
Bullish Breakout Scenario
Break and close above $110,840.74 trendline would signal:
Trend reversal or deeper correction of prior downtrend.
Potential upside targets: $114,000, $117,500, or even $120,000+.
Bearish Continuation Scenario
Rejection at trendline and a break below $101,370.28 support would confirm:
Continuation of the downtrend.
Next support zones: $97,500, $95,000, $92,000.
Trading Strategy Ideas
Short Setup
Entry: Near trendline at $110,840.74
SL: Above recent swing high (~$112,500)
TP1: $105,000
TP2: $101,370
TP3: $97,500
Long Setup (only on confirmed breakout)
Entry: Above $111,000
SL: Below $110,000
TP1: $114,000
TP2: $117,500
Indicators to Watch
RSI: If below 50, bearish momentum still active.
MACD: Crossovers may hint at trend shifts.
Volume: Rising volume on breakout = confirmation.
Leave A Comment