XAU/USD (Gold) 4H Chart Analysis
Key Technical Elements
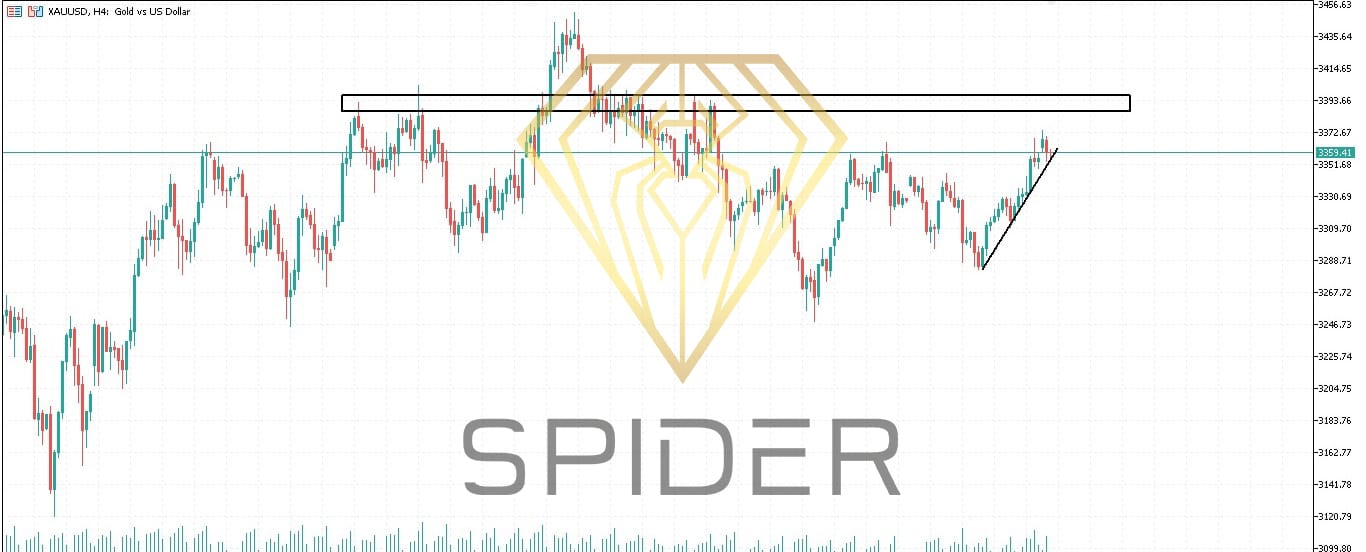
Resistance Zone
Located around 3393.00 – 3415.00
• This area has acted as a major supply zone, where price was previously rejected multiple times in early June and mid-June.
- Price is currently testing the lower boundary of this resistance. Bullish Trendline Support
- The rising black trendline shows higher lows, suggesting strong buyer interest.
- Price has respected this trendline since around July 5, forming a short-term ascending triangle pattern. Market Structure:
Current price: 3359.41
Price is approaching a confluence point: where the ascending trendline meets horizontal resistance.
This tight structure typically leads to either:
A bullish breakout above the resistance zone
Or a rejection and breakdown below the trendline Bullish Breakout Scenario:
If price breaks and closes above 3415, especially with strong volume:
Expect potential targets: 3445, 3480, and even 3510
Retest of the 3393–3415 zone as support can offer confirmation
Supported by global risk sentiment or weaker USD fundamentals Bearish Rejection Scenario:
A clear rejection near 3393–3410 combined with a break below the rising trendline can trigger a move lower.
First downside targets: 3320, 3280, and the support zone near 3250
RSI or volume divergence would support this view Signal Watch:
Aggressive trade: Short near resistance with SL above 3415
Conservative trade: Buy breakout with confirmation above 3415 and retest
One Reply to “XAU/USD Analysis”
Robert Hall10/04/2026
Really enjoyed reading this. Your perspective on this topic is very interesting. Thanks for putting this together. (ref:44a10efc7c9a)