Technical analysis for GBP/USD Timeframe: 4H
Key Levels Identified:
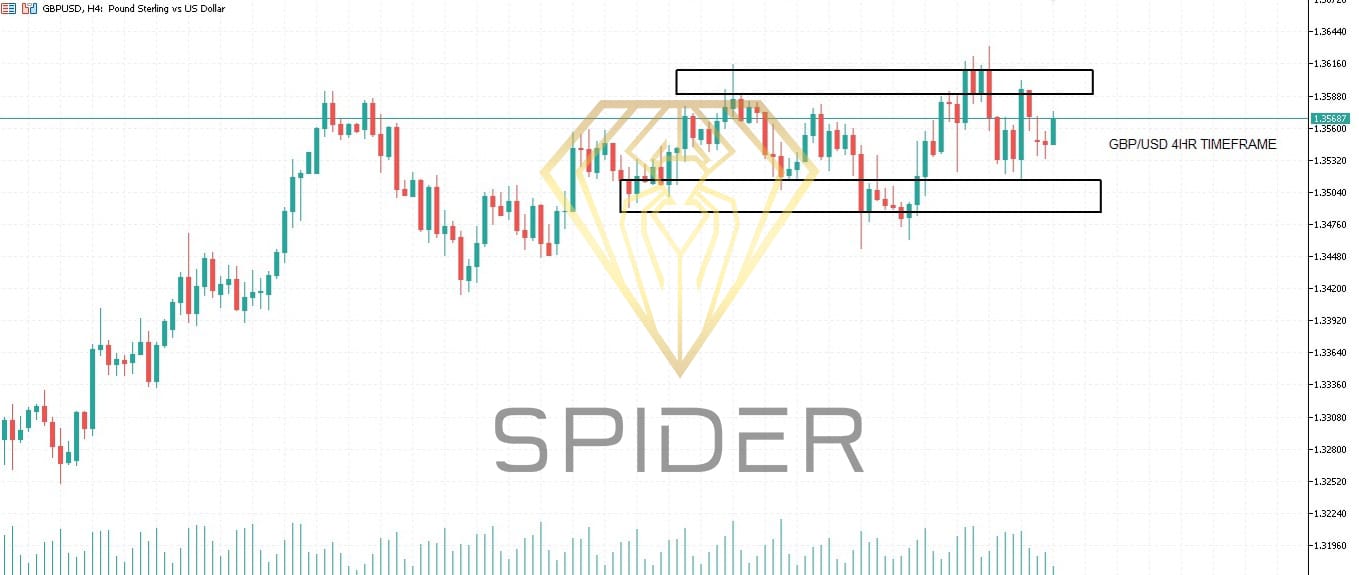
Resistance Zone:
Upper Range: Around 1.36500–1.36800
This zone has been tested multiple times and rejected, showing clear supply pressure.
Price struggles to sustain above this region, indicating strong seller presence.
Support Zone:
Lower Range: Around 1.34800–1.35000
Multiple wicks and closes above this zone — indicating accumulation or buyer support.
Market Structure:
The market is currently ranging (sideways) between these two horizontal zones.
No clear breakout yet in either direction.
Buyers and sellers are battling for control between 1.35000–1.36800.
Forecast & Scenarios:
Bearish Scenario:
If price fails to break above the resistance at 1.36500–1.36800 and forms bearish candles:
Expect a pullback or full reversal to support zone at 1.35000
Break below 1.34800 would target 1.34200 next
Bullish Breakout Scenario:
If price breaks and closes above 1.36800 with strong volume:
Next resistance targets: 1.37250 and 1.37700
Structure shifts to a potential uptrend breakout
Trade Setup Idea (Range-Based):
Direction Entry Stop Loss Take Profit (TP1) Take Profit (TP2)
Sell 1.36500–1.36800 1.37050 1.35500 1.35000
Buy 1.34800–1.35000 1.34500 1.35800 1.36500
Summary:
Element Status
Trend Range-bound / Sideways
Resistance Zone 1.36500 – 1.36800
Support Zone 1.34800 – 1.35000
Breakout Watch Above 1.36800 or below 1.34800
Bias (for now) Neutral until breakout
Leave A Comment