XAU/USD Analysis
Key Levels:
Type Price Levels
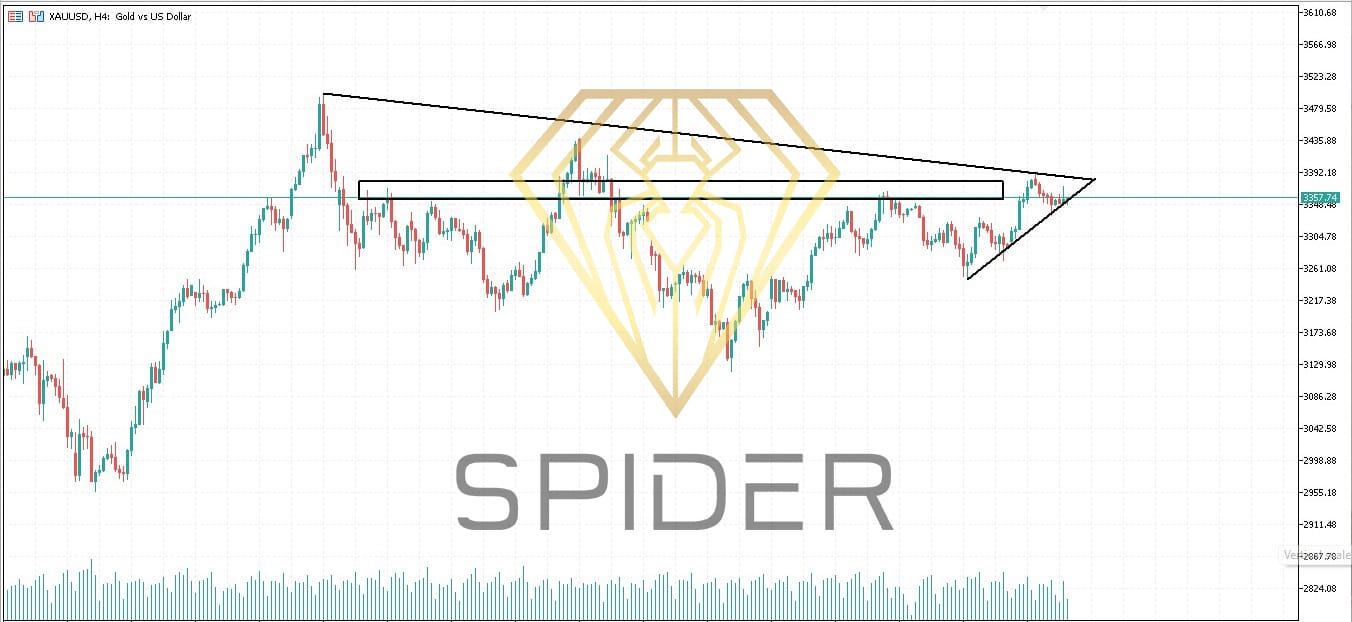
🔺 Horizontal Resistance $3366.845
🔺 Trending Resistance $3500.436 → $3403.752 (Descending)
🔻 Trending Support $3245.869 → $3337.455 (Ascending)
- Horizontal Resistance at $3366.845
This is a static resistance zone, where price previously found selling pressure.
Price is currently near or testing this level.
Scenarios:
A rejection here signals a possible pullback to the rising support zone.
A breakout above (confirmed by a strong candle close + volume) targets the trendline resistance zone above.
- Trending Resistance Zone ($3500.436 → $3403.752)
This is a descending resistance trendline area — price is likely to struggle to move higher within this band.
Implication:
Acts as a dynamic resistance zone — harder for bulls to break without strong momentum.
Any bullish breakout above $3500 is a very strong continuation signal, possibly leading to new highs.
- Trending Support Zone ($3245.869 → $3337.455)
This is your rising support trendline, where buyers are likely stepping in, forming higher lows.
Implication:
As long as price respects this zone, the bullish structure remains intact.
A break below $3245 would shift the bias to bearish, opening room for deeper correction toward $3200 or lower.
Price Structure Summary (Wedge or Channel Formation)
The current price action likely forms a rising wedge or ascending channel:
Top of wedge: $3403–$3500
Bottom of wedge: $3245–$3337
Middle: Horizontal resistance at $3366.845
This creates a compression zone, and a breakout in either direction will lead to a strong move.
Strategic Outlook
Scenario Bias Strategy
Price rejects $3366.845 Bearish short-term Sell toward $3337–$3245 support zone
Breaks and holds above $3366.845 Bullish short-term Buy toward $3403–$3500
Price breaks above $3500.436 Strong bullish Target $3600+, use breakout strategies
Price breaks below $3245.869 Bearish reversal Short on retest; target $3200–$3100
Tools for Confirmation
RSI: Overbought near $3366 or $3500 = possible reversal signal
MACD: Watch for momentum divergence
Volume: Higher volume on breakouts = more reliable
Candlestick Patterns: Look for engulfing, pin bars, or inside bars at key levels
Conclusion
XAU/USD is currently trading between a rising support and descending resistance, forming a tightening structure. The breakout direction from this compression range will likely define the next major trend.
Leave A Comment