Technical Overview
Current Price Action: GBP/USD is trading above the significant support zone around 1.3250, with the 20-day simple moving average (SMA) providing additional support. A bullish reversal pattern, such as an inverted hammer, has formed near this level, indicating potential upward momentum.
Trendline Analysis: The pair has been guided by a major ascending trendline since January 13, 2025, with recent price action testing this trendline near 1.2705. A rebound from this area could signal a continuation of the bullish trend.
Momentum Indicators: The Relative Strength Index (RSI) recently dipped to 31, approaching oversold territory. This suggests weakening downside momentum and potential for a bullish reversal.
🔧 Key Levels
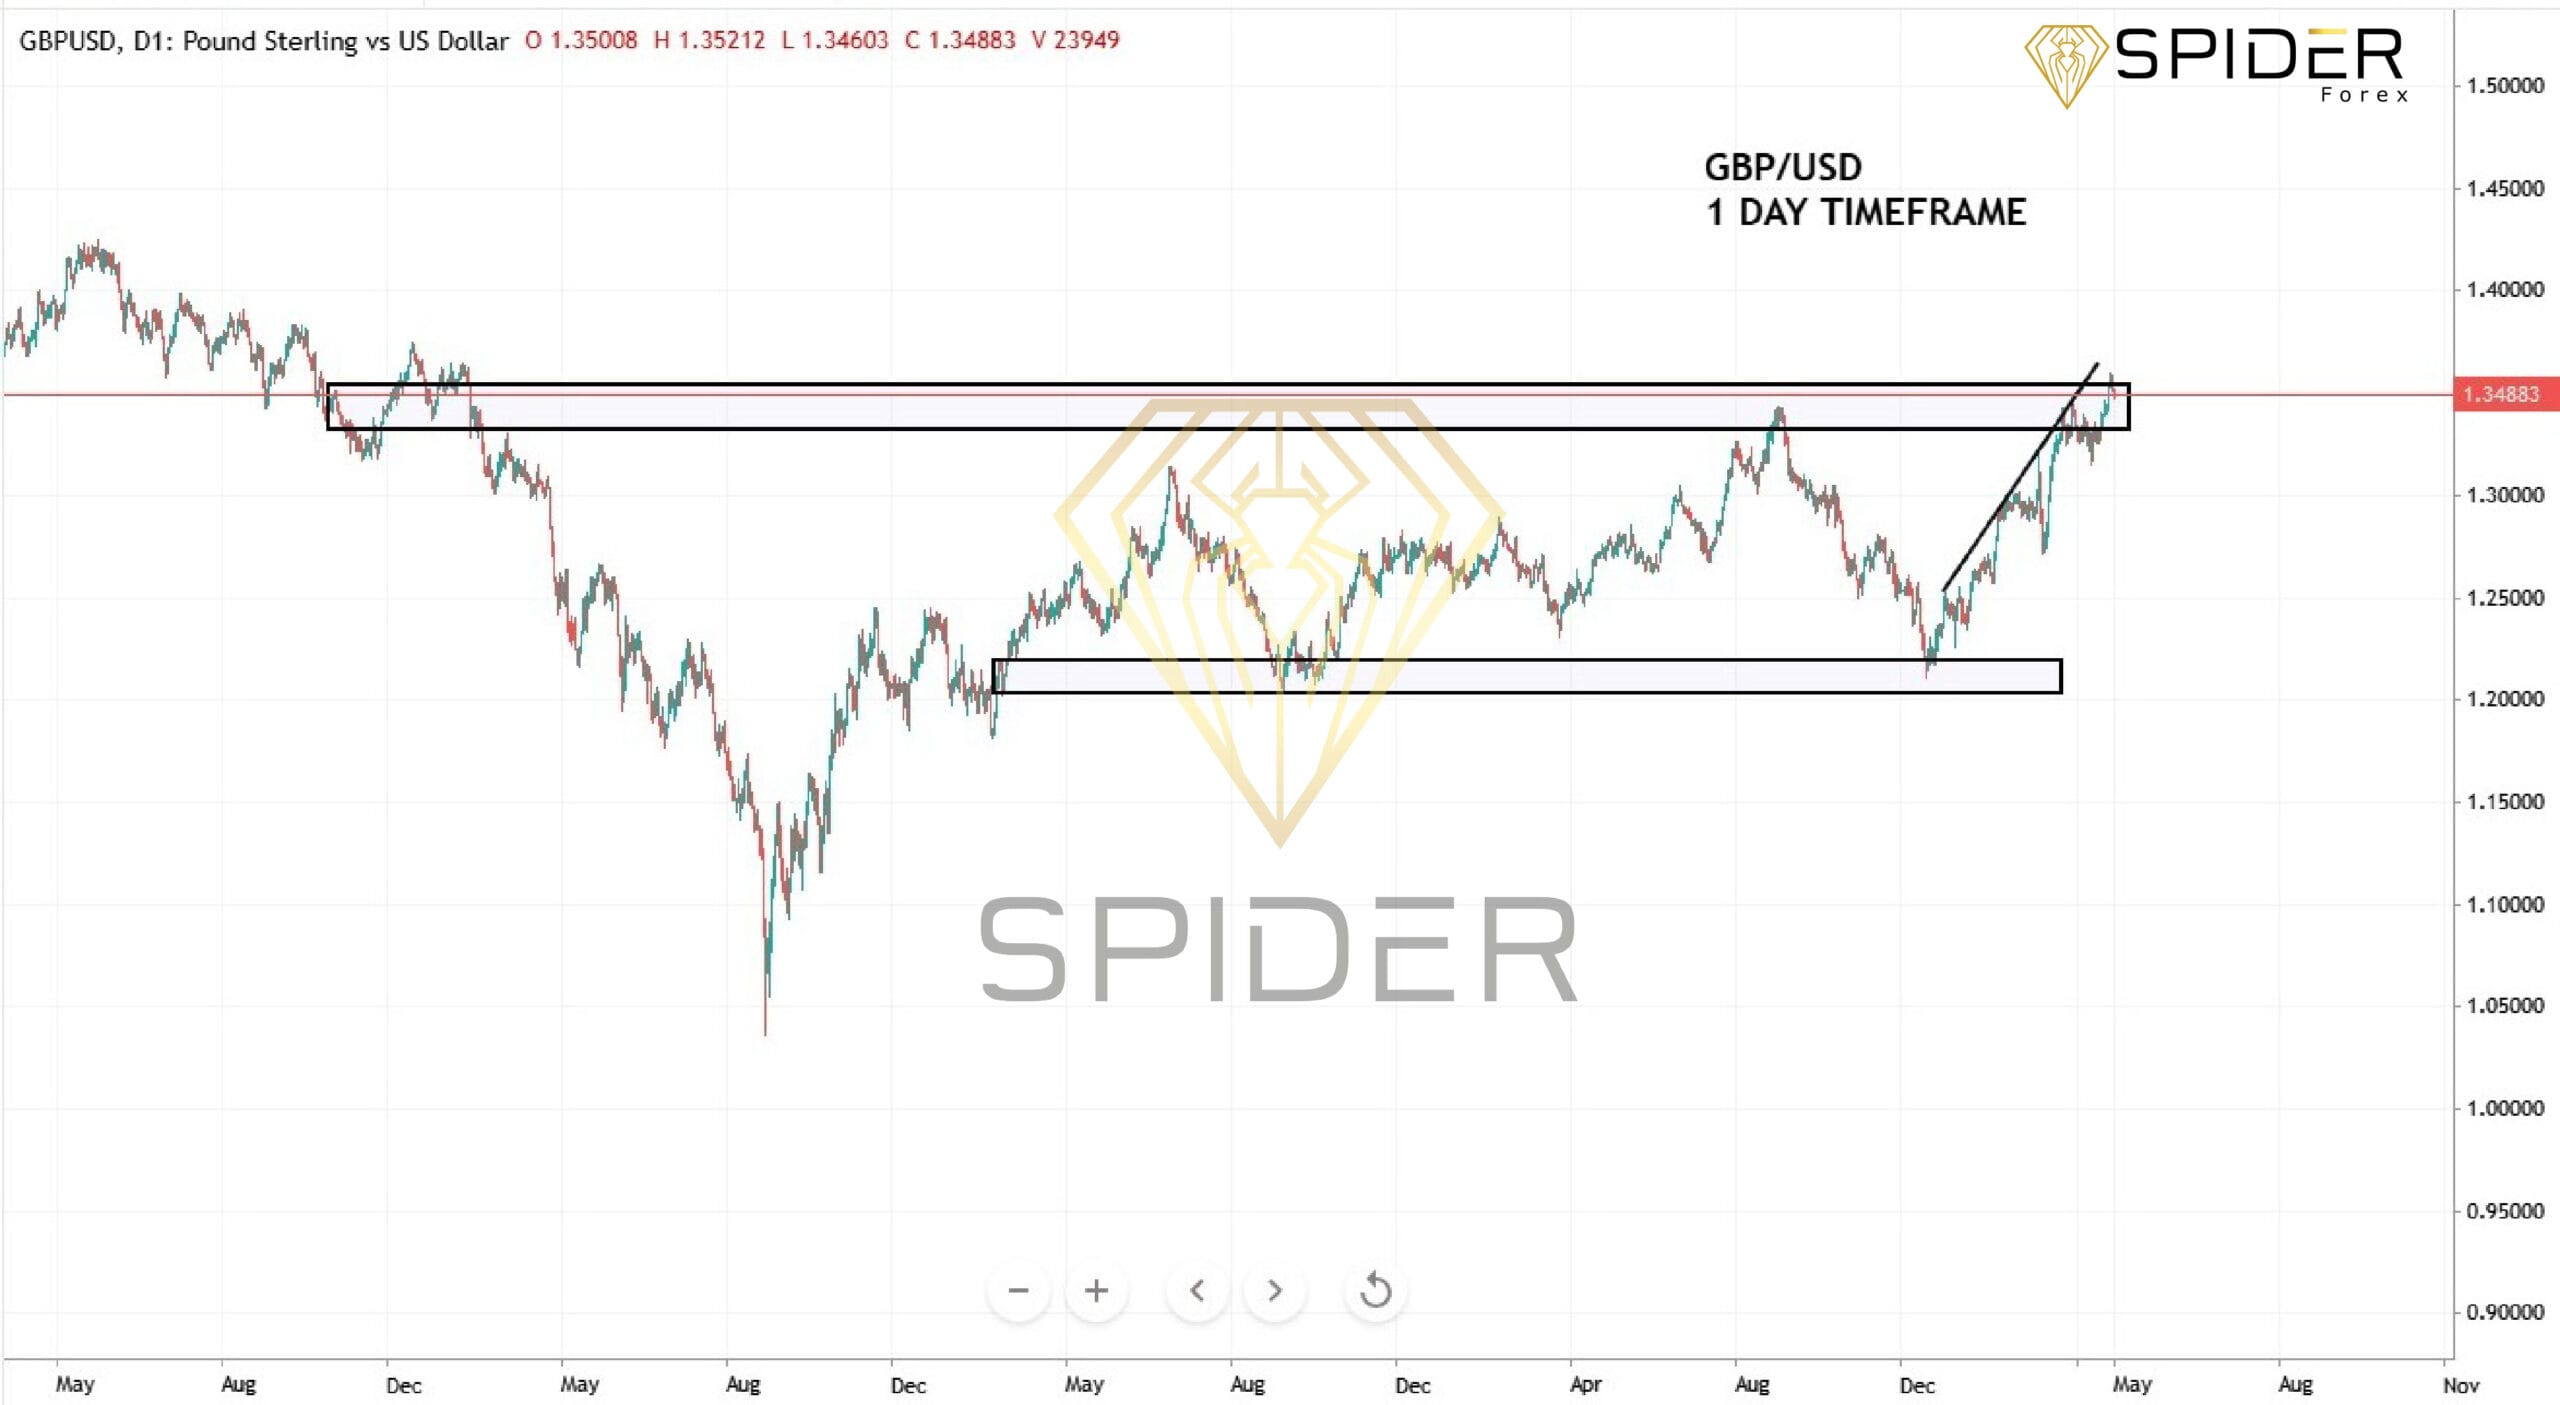
Support Levels: 1.3250 (20-day SMA), 1.2705 (ascending trendline), 1.20175 (major support)
Resistance Levels: 1.3285 (short-term resistance), 1.3300 (psychological level), 1.34720 (major resistance)
Trading Outlook
Bullish Scenario: A sustained move above 1.3285 could lead to a rally toward 1.3300 and 1.34720, with potential for further gains if the trendline support holds.
Bearish Scenario: A drop below 1.3250 may signal a pullback toward 1.2705 or 1.20175, depending on the strength of the decline.
Leave A Comment