📈 Technical Analysis: XAG/USD (Silver vs. US Dollar) – H4 Timeframe
🔍 Current Price Action & Trend
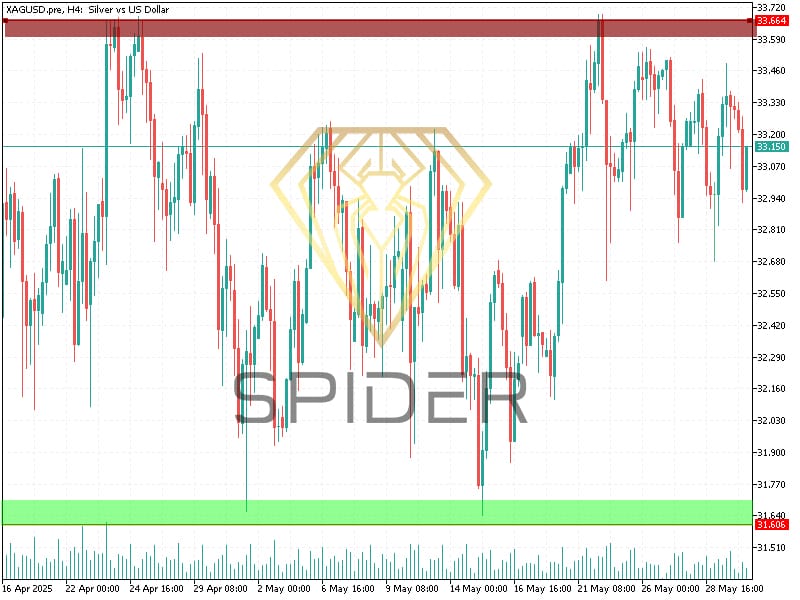
- Latest Price: $31.51 (as per last data point)
- Dominant Trend: Bullish (Higher highs & higher lows from $31.64 → $31.00 → $31.51).
- Key Pattern: Pullback after breakout (Retesting support after spike to $31.00).
📊 Critical Levels
| Type | Level | Significance |
|---|---|---|
| Resistance | $32.03 | Previous swing high (16 May) |
| $31.90 | Recent consolidation zone | |
| Support | $31.51 | Current price – Immediate defense line |
| $31.00 | Major psychological & breakout level (21 May) | |
| $31.64 | Strong historical support (16 May) |
📉 Technical Indicators
- Price Structure:
- Bullish Breakout: Surge to $31.00 (21 May) broke $31.64 resistance.
- Retest in Progress: Current pullback to $31.51 testing breakout validity.
- Volatility Insight:
- Sharp drop from $31.00 → $31.51 suggests profit-taking.
- Holding above $31.00 keeps bulls in control.
🎯 Trade Strategy
Scenario 1: Bullish Continuation
- Trigger: Bounce from $31.51 or $31.00 support.
- Entry: $31.30 – $31.50
- Targets: $31.90 → $32.03 → $32.30
- Stop Loss: Below $31.00 (breakout invalidation).
Scenario 2: Bearish Reversal
- Trigger: Close below $31.00 with momentum.
- Entry: $30.95
- Targets: $31.64 → $31.90 (role reversal to resistance)
- Stop Loss: Above $31.20.
⚠️ Key Risk Events
- US Inflation Data: Impacts USD strength → Silver volatility.
- Industrial Demand Signals: Watch for PMI data from US/China.
📌 Tactical Insight
“Buy the dip near $31.00 if USD weakens. A hold above $31.00 opens path to $32.30.
Failure below $31.00 signals bull trap → target $31.64.”
Leave A Comment